Two-Thirds of Dutch People Live Within 15 Minutes Cycling of Train Station
17 June 2021A study conducted by Breda University of Applied Sciences (BUas) shows 11.7 million Dutch people live within 15 minutes cycling distance of the train station. The study was conducted to gain insight into the bicycle accessibility of all municipalities in the Netherlands. This is particularly important now, because the Netherlands is facing a major housing challenge in the coming years. If bicycle accessibility is not considered in housing planning, we will fall behind the sustainability ambition in the field of mobility. The results of the study are presented by BUas in the Atlas Bereikbare Stad, a so-called Digital Twin of the Netherlands.
Bicycle Accessibility Central
The research conducted by the BUas lectorate Urban Intelligence looked at the cycling and walking accessibility of train stations, bus stops and important locations such as city centers, schools and shopping centers. The importance of walking and cycling for a liveable and accessible city has been recognized for years. Yet, concretizing this in spatial policy remains a challenge for many municipalities. Therefore, the Bicycle Oriented Development (“BOD”) concept has been developed. This integrated data-driven planning concept maps the current bicycle accessibility of key destinations in municipalities in detail and enables the creation of future scenarios. This allows spatial development and bicycle policy in municipalities to be better coordinated. “With BOD we make the integral approach to spatial development and cycling policy explicit” – Paul van de Coevering, Professor of Urban Intelligence at BUas.
Analysis and Results
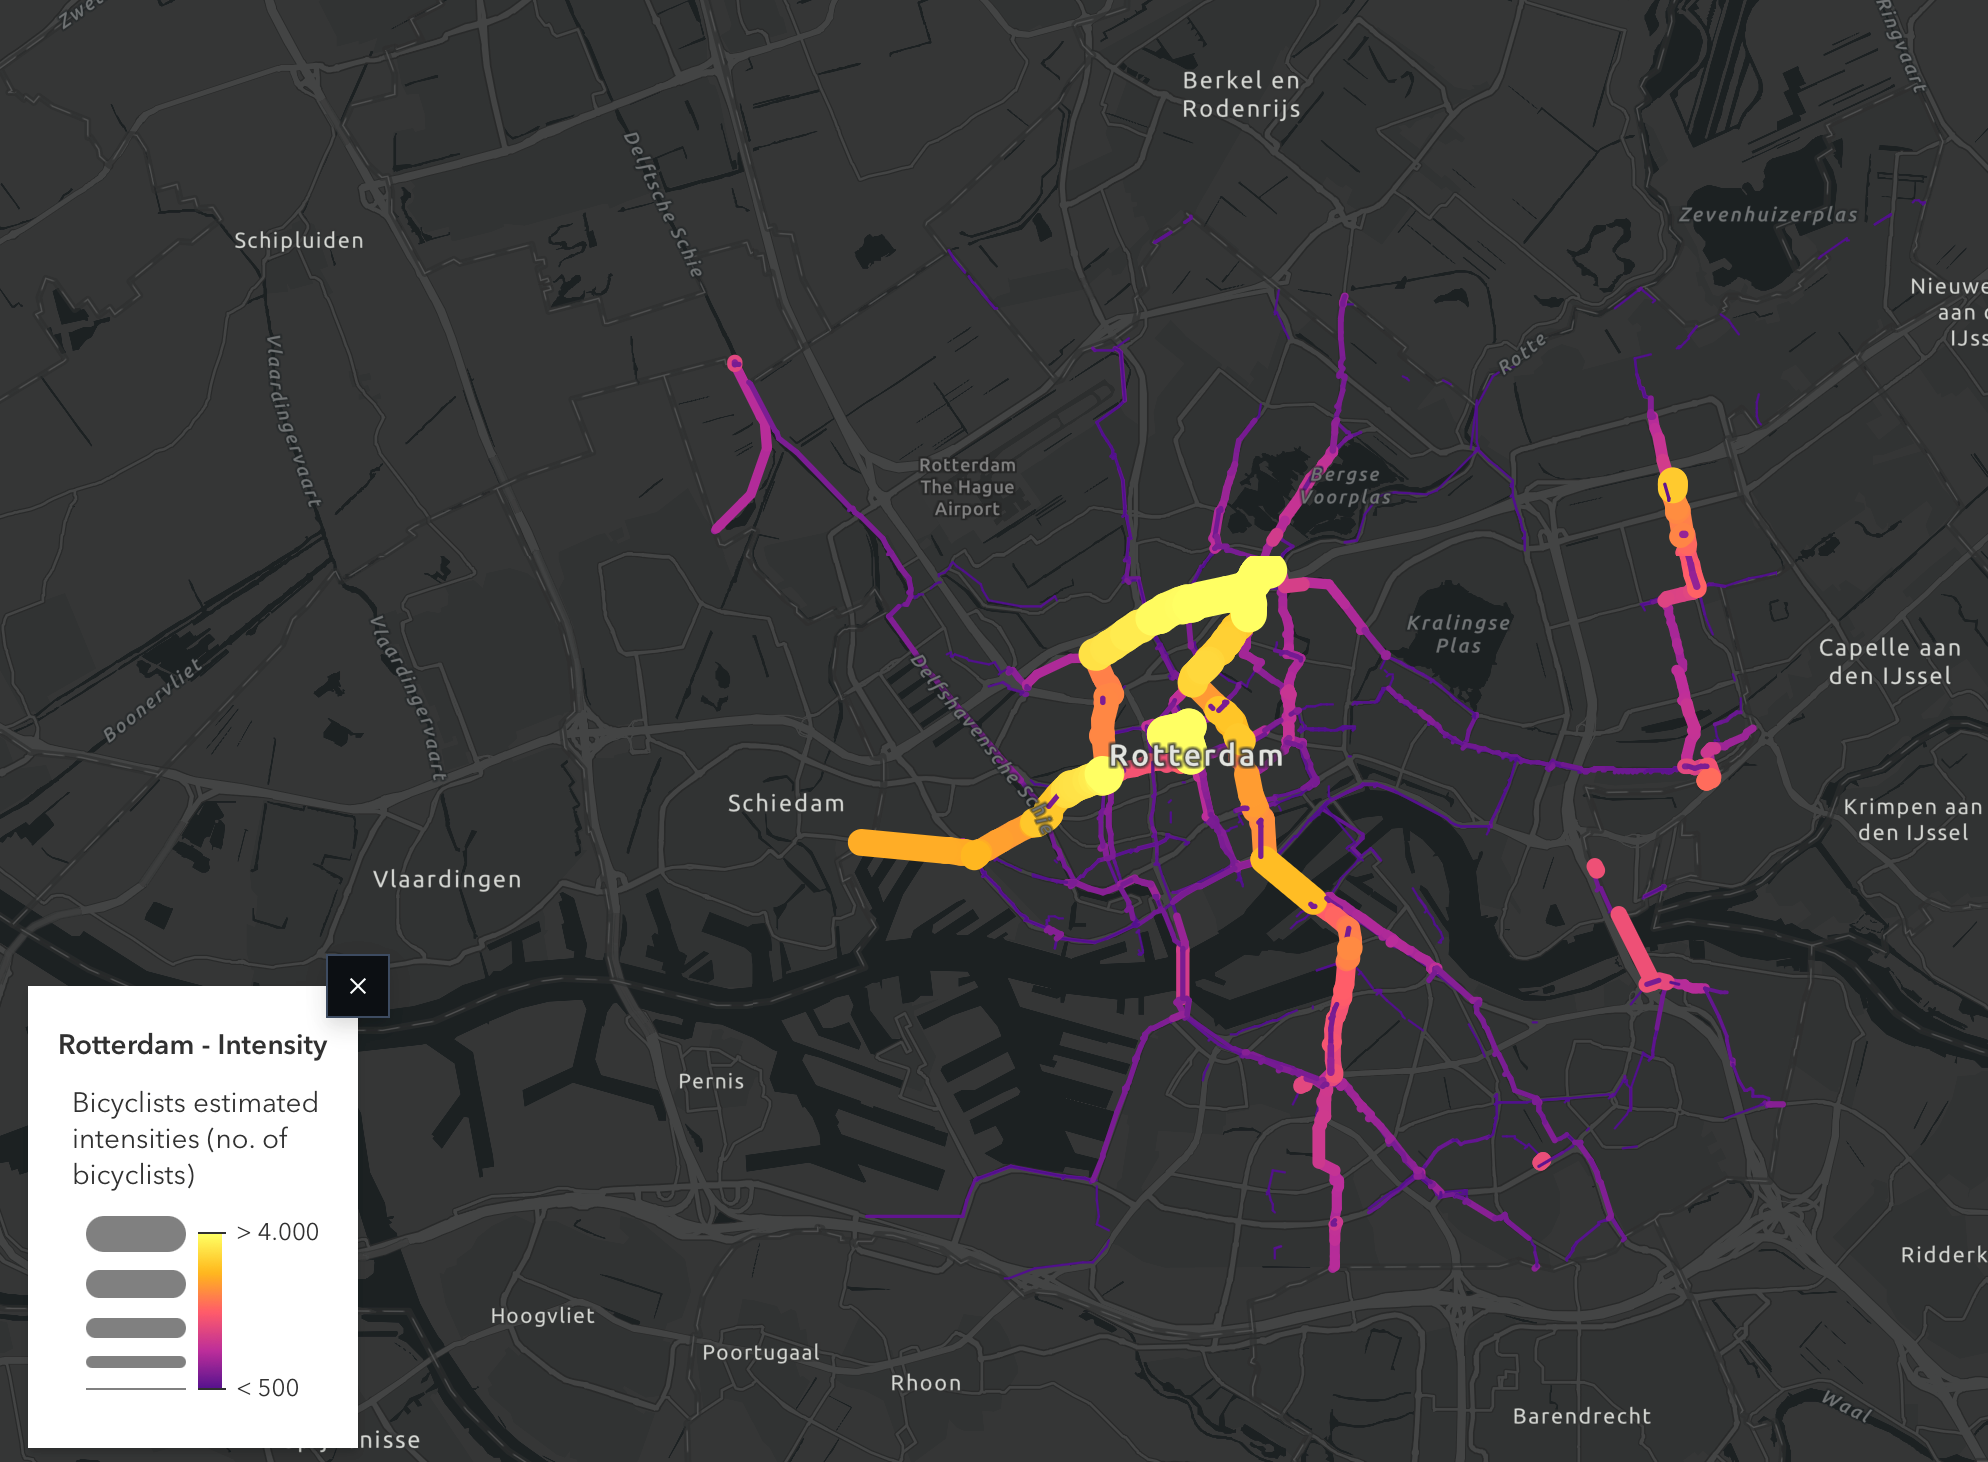
In order to visualize the bicycle accessibility of relevant destinations, an important step has been taken by working with actual bicycle travel times from GPS data instead of straight-line distances. For BOD the cycling travel times are based on the GPS data from the National Cycling Weeks. A remarkable result is that on average two-thirds of Dutch people live within 15 cycling travel times of a train station. Of the provinces with over a million inhabitants, North Holland scores the highest with 77% and North Brabant currently the lowest with 55%. “At the same time, the construction of express cycle routes offers potential for improved bicycle accessibility in provinces like North Brabant. This shows that the bicycle-train combination still has a lot of potential in the Netherlands” – Joost de Kruijf, program leader Dutch Cycling Intelligence at BUas.
Digital Dashboard
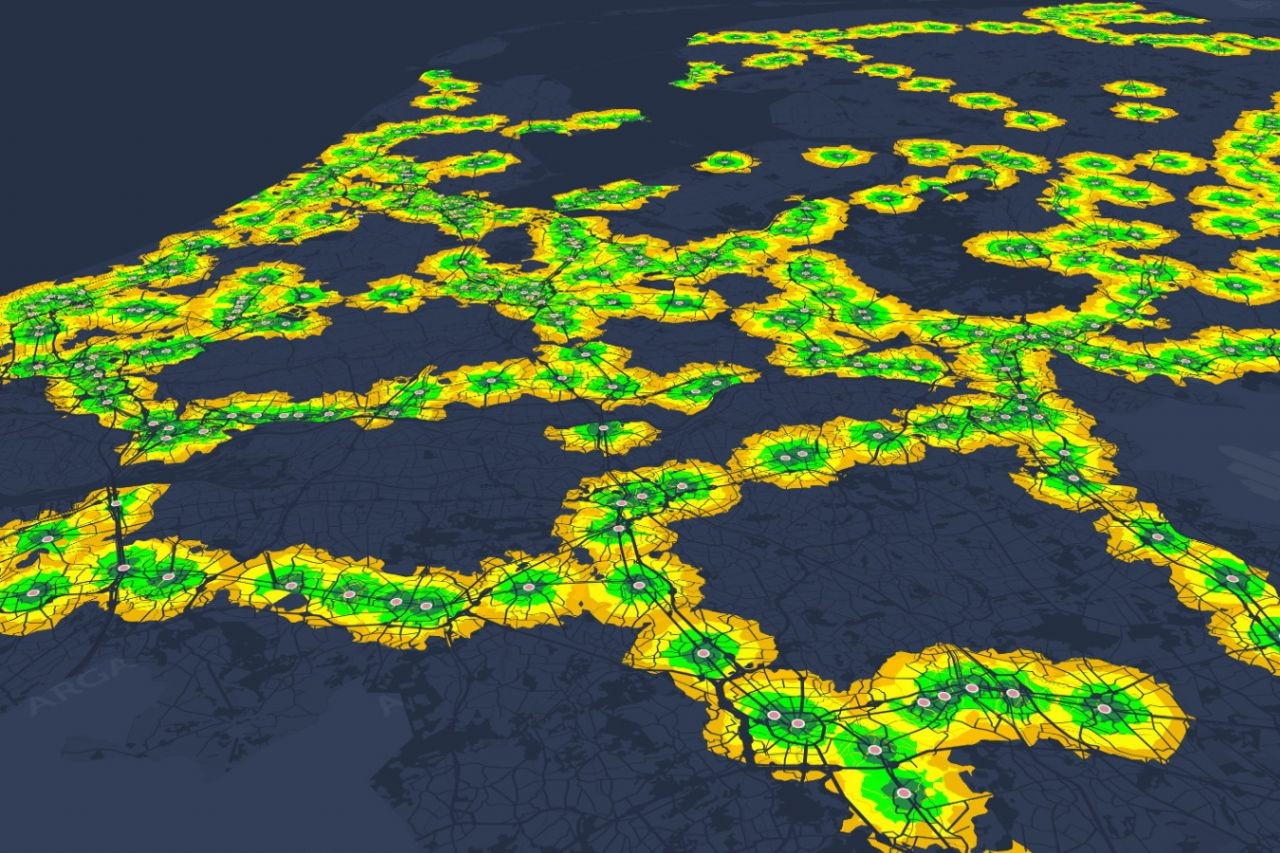
The results of the research will be made available to government agencies through an online digital 3D dashboard of the entire Netherlands, a digital twin. The online 3D display makes it possible to make statements down to individual property level. It also makes it easy for users to orient themselves and get started with the analyses. This digital twin was developed by the company Argaleo.
National Developments
Recent developments in the field of Talking Bikes, in which current GPS data is collected on a national scale, will only increase the opportunities for implementing BOD in the coming years. The national Tour de Force action program endorses the opportunities for BOD in the task of urban cycling and high-quality (fast) cycle routes. BUas hopes that the development of BOD will strengthen the national data-driven cycling policy.
For more information on the research and results, please contact Joost de Kruijf.
To access the dashboard you can request a login using this link.
The table below shows the scores per province.
| Province | Number of Inhabitants within 15 minutes cycling | Total population | Percentage |
| South Holland | 2.515.815 | 3.735.965 | 67% |
| North Holland | 2.246.074 | 2.902.006 | 77% |
| Gelderland | 1.479.230 | 2.081.095 | 71% |
| Noord-Brabant | 1.379.592 | 2.571.508 | 54% |
| Utrecht | 979.878 | 1.347.122 | 73% |
| Overijssel | 883.155 | 1.178.274 | 75% |
| Limburg | 796.169 | 1.123.610 | 71% |
| Groningen | 383.600 | 579.679 | 66% |
| Flevoland | 300.276 | 426.678 | 70% |
| Friesland | 299.589 | 668.944 | 45% |
| Drenthe | 230.594 | 499.337 | 46% |
| Zeeland | 167.784 | 411.471 | 41% |
| Nederland | 11.661.756 | 17.525.689 | 67% |